Heads up: We refresh this post every year to make sure we include the most up-to-date information about marketing budget breakdowns.
You know you need to dedicate at least some of your budget and time to marketing. But what percentage of your revenue should you set aside? And what marketing tactics should you prioritize?
These are important questions! And we wanted answers. So we did the research into companies and institutions across industries like SaaS, higher education, manufacturing, and fintech, to see how their marketing budgets break down and what ROI they typically see.
Need Help Allocating Your Marketing Budget? Download Our Marketing Budget Template >
Key Takeaways for 2024
- Average marketing budget as a percentage of revenue was 9.1% in 2023.
- More than half of marketers report inflationary pressures causing a decrease in spending.
- 75% of CMOs said they were tasked with doing “more with less” in 2023.
- Between 2022 and 2023, 51% of CMOs increased spending on marketing data and analytics.
- Spending on social advertising is up, while search advertising budgets are down.
(Sources: Gartner State of Marketing Budget and Strategy 2023; The CMO Survey March 2023)
The ROI from a Healthy Marketing Budget
Businesses large and small understand the importance of prioritizing their marketing budgets.
Marketing budgets as a percentage of revenue hit a low of 6.4% in 2021, and while that number bounced back to 9.1% in 2023, it’s still down from an average of 12.1% across industries in 2016.
While the rule of thumb has long been to start with a baseline of at least 10% of your revenue spent on marketing and adjust from there based on things like your company’s stage of development (start-ups may need to spend a higher percentage than established companies) and brand awareness (lower awareness equals higher marketing costs), the reality is that, in 2024, many companies are trying to do more with smaller marketing budgets.
If that’s you, we have good news.
By focusing your marketing budget on high-return activities that make the biggest impact on your bottom line, you can achieve healthy revenue growth with a lower spend. Prove the return on investment (ROI) this year, and you’re in a great position to increase your marketing budget next year — and to know just what to do with that budget to keep the leads and sales rolling in.
So, what percentage of your company’s revenue should you budget for marketing in 2024? And how should you allocate those resources to maximize your ROI? Let’s start by looking at a few examples by industry.
Marketing Budget Examples by Industry

10% — for years, this has been the magic number you would likely hear if you asked how much of your revenue you should spend on marketing. But is that true for everyone? What about a company in its growth phase versus a well-established brand like Apple? What about companies in different industries? Should a consumer packaged goods brand spend the same percentage of revenue on marketing as a B2B manufacturing company?
According to the 2023 CMO Survey produced in collaboration with Deloitte, Duke’s Fuqua School of Business, and the American Marketing Association:
“Considering the effect of inflationary pressures on spending, the majority of companies report a decrease in marketing spending levels (52.0%) or no impact (31.4%), while just 16.6% report an increase.”
Of course, these figures vary dramatically when you drill down into each industry. Research by Statista found these marketing budget averages based on industry:
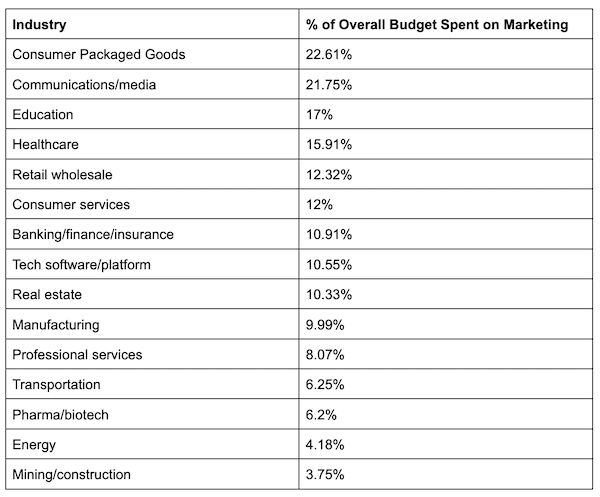
Marketing budgets also vary by company revenue, with the lowest-grossing companies spending a greater percentage of both their revenue and their overall budgets on marketing.
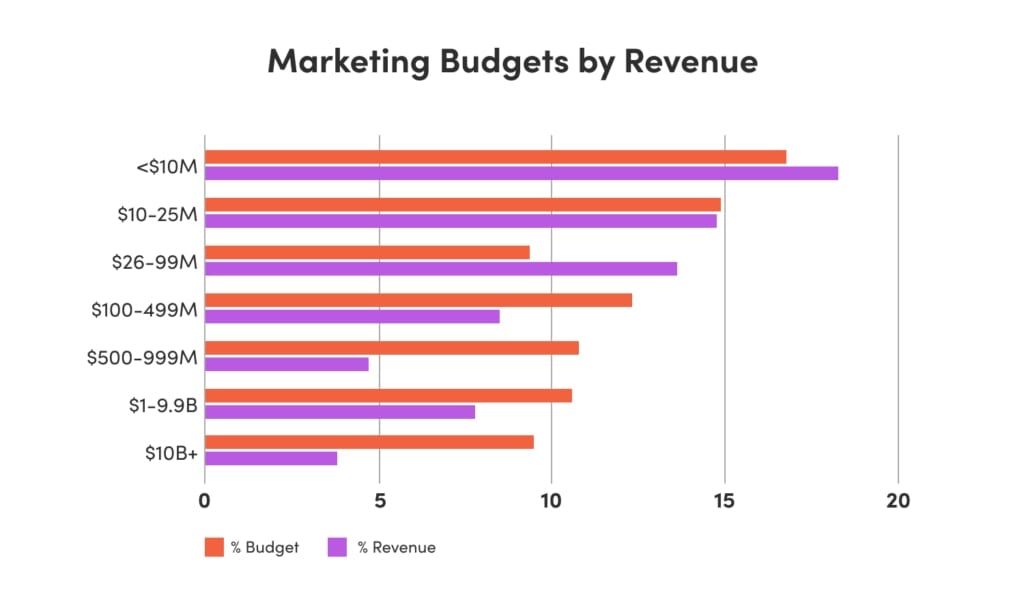
While the 10% guideline may be right for some businesses, it’s not a one-size-fits-all figure.
These averages help set the playing field, but we wanted to know what actual, individual companies and higher education institutions spend on marketing. So, we set out to do something that no writer ever wants to do: math.* Here’s what we discovered about marketing spend as a percentage of revenue by industry.
*We’re writers, not technophobes. This year, we had ChatGPT do our math for us. Welcome to 2024!
Software / SaaS Companies
Salesforce, Atlassian, and Asana are all in the business of keeping other businesses organized and efficient through software platforms. Let’s take a look under the hood at their revenues and marketing budgets.
Salesforce
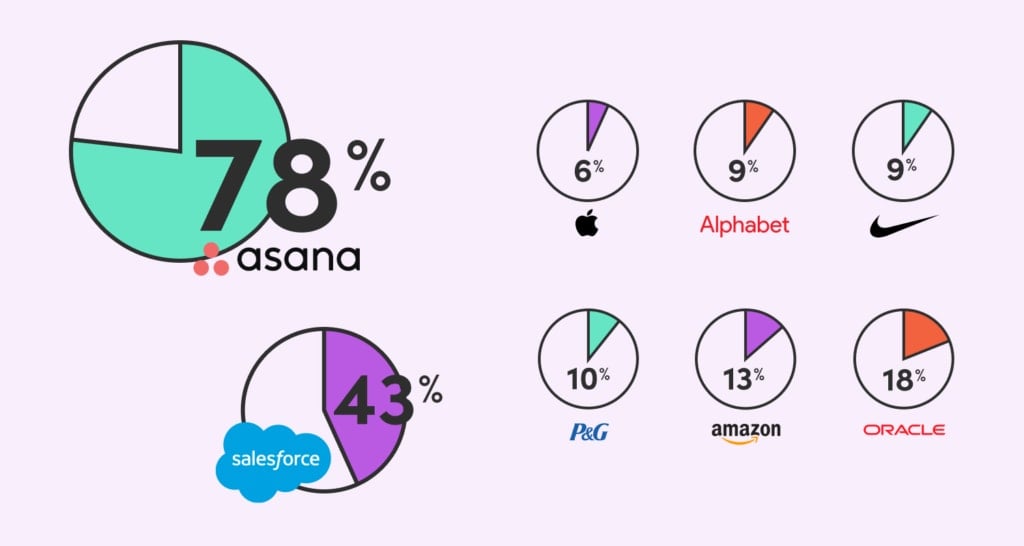
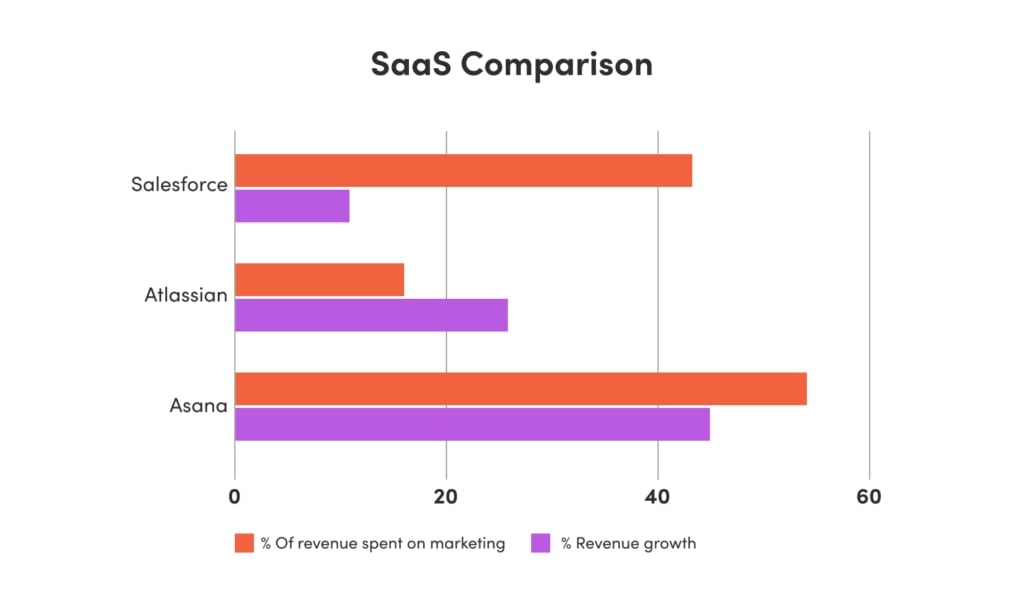
Salesforce, a leading provider of marketing automation and customer relationship management (CRM) tools, has consistently been one of the heaviest hitters in terms of marketing budget, spending a whopping 43% of the company’s $31.3 billion in revenues on sales and marketing in 2023.
That was down from 45% in 2021 and 2022 — but it still far outpaces most of the organizations we researched. (With the exception of Asana, which we’ll get to in a moment.) The result?
The company has two main revenue streams: professional services and subscription revenue. While professional services are run at a loss (-$208 million gross in 2022), their much larger subscription revenue cost structure has generated $23.2 billion in gross profits in 2023.
Not too shabby. But when we look at growth, Salesforce’s revenue has grown only 11% in the last year, which is behind the next company we’ll look at, Atlassian (24% growth).
Atlassian
Atlassian makes software for software developers and organizations — most notably Jira, a popular bug-reporting and tracking tool.
Atlassian spends 15-16% of their $2.8 billion in revenue on sales and marketing. That’s 5-6% over the industry average of 10.55%. (But tiny compared to Salesforce.)
Says CRO Cameron Deatsch, that marketing allocation “allows us to invest 35% to 45% of our revenue in R&D.”
So, how is that strategy working out for them? Well, they’ve come a long way from when the company’s co-founders started the business 20 years ago with $10,000 on credit cards. Whereas the company showed a $32.9 million profit in 2022, that fell to an operating loss of $161.6 million during Q3 of 2023.
However, the picture isn’t as grim as it may seem. Atlassian exceeded their revenue projections last year, growing 26% to $3.53 billion in FY 2023 — and in this economy, in this industry, growth may be a more dependable measure of success than profitability.
Asana
A provider of workplace management and productivity software tools, Asana was founded in 2008 and went public in 2020.
The company’s total FY 2023 revenue was $547.2 million — of which they spent $428.4 million, or 78.3%, on marketing. Bam! That’s a lot.
Like Atlassian, Asana is currently losing money. They reported a GAAP operating loss of $407.8 million, or 75% of revenues in 2023. Now that’s a lot. However, according to the company’s 2023 financial reports, they experienced revenue growth of 45% year-over-year.
SaaS Comparison
Fintech Companies
The fintech landscape in 2023 can be summed up by one word: volatile. If you look at the top fintech brands of 2022 — Stripe, Klarna, and FTX — only one of them (Stripe) still makes the Forbes list of top 10 fintech companies in 2023, and its valuation is down by almost 50% since last year. Klarna not only fell out of the top 10, it didn’t even make the list of top 50 fintechs in 2023. As for FTX, they’re undergoing bankruptcy, and their founder faces accusations of fraud.
Yikes!
So how does all this market volatility impact the marketing budgets of fintech companies in 2024? This is a little tough to answer, as many of the top contenders (including Stripe) have yet to go public — which means their budget breakdowns are generally hush-hush. Did we let this stop us? We did not!
Adyen, PayPal, and Block (formerly known as Square) are all big players in the payment processing space, and, as publicly traded companies, their revenue and marketing budgets are readily available with a little digging.
Adyen
Adyen is a global payment processing solutions provider based in the Netherlands. Their bread and butter is payment processing for large businesses — customers include Microsoft and McDonald’s.
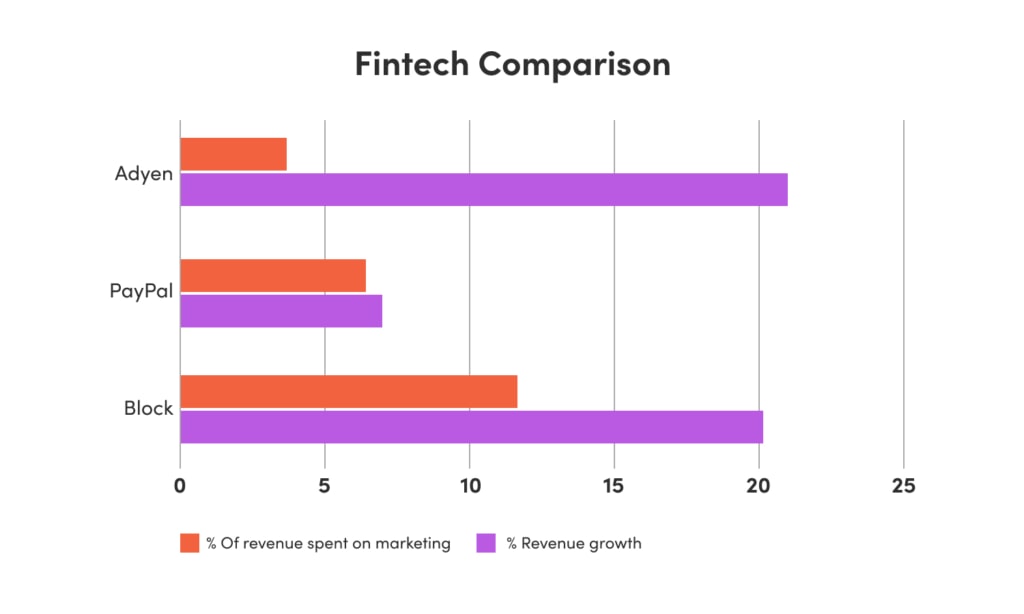
According to their shareholder letter for the first half of 2023, sales and marketing expenses for that period totaled €27.4 million ($29.81 million), which is up 13% year-over-year. Adyen reported €739.1 million ($804.18 million) in revenue during that period, putting their marketing spend at only 3.71%.
So, how is the company performing? Overall, revenues are up 21% year-over-year, with an EBITDA margin of 43%. North American revenue has grown at a slower rate than expected — 23% in H1 2023 compared to 52% in H1 2022.
PayPal
PayPal is, well, PayPal. Founded in 1998 in Palo Alto, CA, they’re in the business of online payment processing — including for large businesses (Uber is a recent customer acquisition), oodles of small and medium business, and peer-to-peer transactions via Venmo.
In 2022, the company posted $27.5 billion in revenue, and spent $1.8 billion on marketing, according to Statista. That’s about 6.55% of revenue spent on marketing.
With 433 million active users and a global market share of almost 42%, it’s the most popular payment app. But, revenue growth was slower than Adyen’s at 7.07% for FY 2023.
Block
Formerly known as Square, Block is the umbrella brand that comprises both the merchant payment platform still known as Square as well as Cash App, a peer-to-peer mobile payment app to rival Venmo.
For fiscal year 2022, Block’s revenue was $17.532 billion, and they spent $2.058 billion on sales and marketing. That’s 11.7% of revenue spent on sales and marketing. Good times! But will it last?
According to Insider Intelligence, it was predicted in 2023 that Block would “curb marketing and sales expenses, which grew 25% YoY in 2022. It [anticipated] this segment’s expenses to grow between 5% and 10% [last] year, driven by Cash App.”
So far, that prediction is borne out by the numbers. In Q1 and Q2 2023, Block spent $1.033 billion on sales and marketing — about 9.81% of the company’s $10.525 billion in revenue for the same period. And, for FY 2023, the company saw a 20.1% increase in revenue to $19.692 billion.
Fintech Comparison
Manufacturing Companies
To review, manufacturing companies spent an average of 9.99% of their revenue on sales and marketing in 2023. Let’s take a look at how a few specific manufacturers break down.
Procter & Gamble
This American manufacturer has the honor of being the world’s biggest spender on advertising — not surprising considering its hefty portfolio of giant consumer brands, including Gillette, Ivory, Pampers, Bounty, and dozens more.
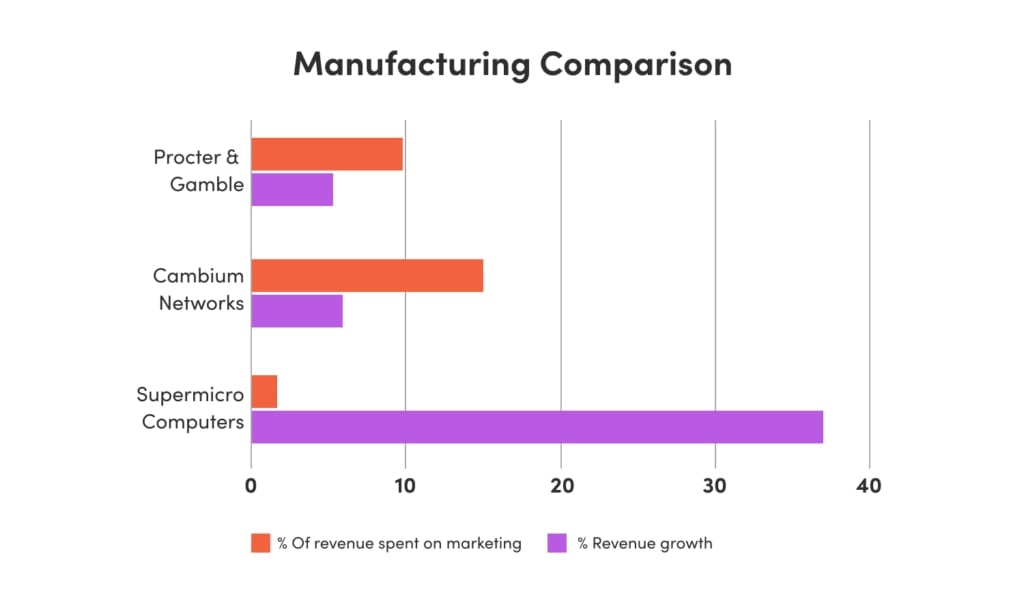
According to Statista, in 2022 the company spent $7.9 billion on advertising, which is 9.84% of their revenue of $80.187 billion. P&G’s revenue grew 5.35% from 2021 to 2022.
Cambium Networks
On the opposite side of the spectrum as P&G, we have Cambium Networks, a B2B manufacturer and distributor of fiber connectivity products. In calendar year 2022, Cambium reported $296.9 million in revenue, and spent $44.452 million on marketing and sales. That’s about 15% of revenue spent on marketing — quite a healthy amount for a B2B manufacturer.
How’s that working out for them? It’s a mixed bag. Cambium’s 2022 revenues were down 12% compared to 2021. But in FY 2023, the company’s revenue grew 5.89% year-over-year.
Supermicro Computers
Straddling the chasm between behemoth P&G and smallish Cambium is Supermicro Computers, a mid-sized B2B manufacturer of server solutions marketed and sold worldwide.
During FY 2023, Supermicro made $7.12 billion in net revenue and spent a miniscule 1.6% of that on sales and marketing, for a total of $115.025 million.
The company is doing pretty well with that meager spend — revenue increased 37% year-over-year for FY 2023.
Manufacturing Comparison
Higher Education
In the face of overall declines in enrollment across higher education, colleges and universities are spending a significant amount of money marketing their programs. In a recent article in The Washington Post, Catholic University president John Garvey says that schools “are competing for students, and marketing is how you have to do that.”
So what was the state of higher education marketing budgets as a percentage of revenue in 2023? We looked at a handful of private universities for answers.
New York University
NYU is the largest private university in the United States, with a total enrollment of 61,724 undergraduates and graduate students as of fall 2022. They spend big money on marketing to attract all those students — but it amounts to only a fraction of their operating revenues. (Less than one percent.)
Annual Marketing and Advertising Spend: $28.125 million
FY 2023 Operating Revenues: $3.957 billion
(Sources: American Caldwell and NYU)
Johns Hopkins
For the class of 2026, Johns Hopkins received 37,156 applicants and enrolled 1,310 new students. They’re one of the biggest marketing spenders in private higher education, but like NYU their marketing budget doesn’t approach one percent of their revenue.
Annual Marketing and Advertising Spend: $29.5 million
FY 2022 Operating Revenues: $7.4 billion
(Sources: American Caldwell and Johns Hopkins)
University of Miami
The University of Miami is a private university with an undergraduate enrollment of 12,089 and an acceptance rate of 28%. They’re on trend with the other private universities we looked at, spending a tiny fraction of their operating revenues on marketing.
Annual Marketing and Advertising Spend: $23.2 million
FY 2022 Operating Revenues: $4.7 billion
(Sources: American Caldwell and University of Miami)
Higher Education Marketing Budget Comparison
According to a 2019 survey of higher education CMOs, here’s a quick look at average marketing budgets by degree type.
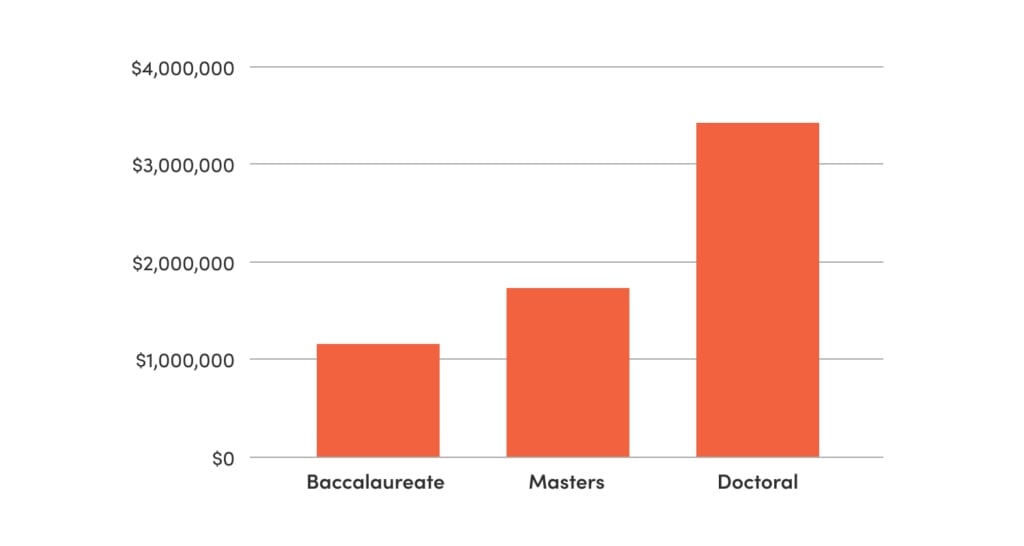
(Interestingly enough, that same survey found that between 15% and 21% of higher education CMOs “don’t know or can’t estimate” their department’s budget.)
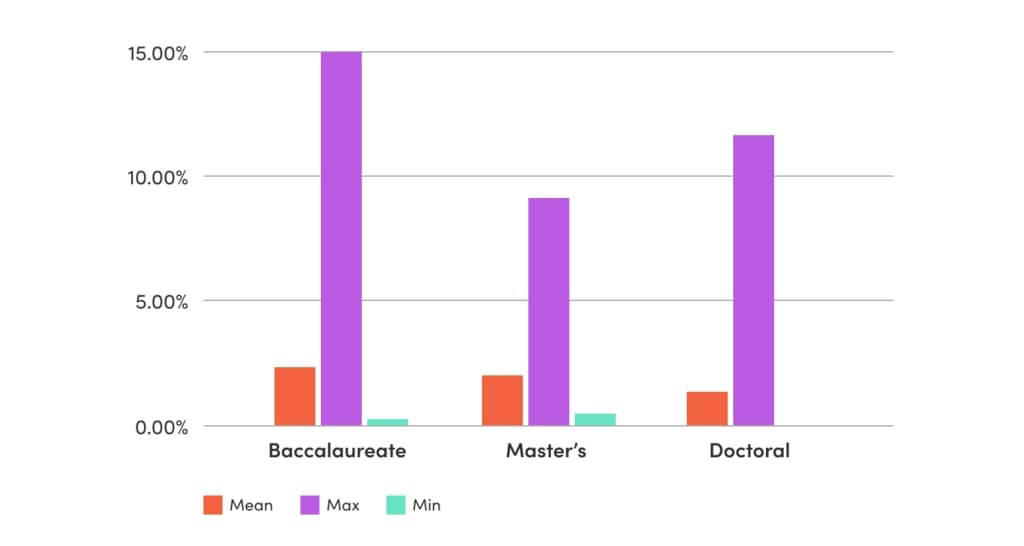
The CMO study also took a look at higher education’s marketing budgets as a percentage of institutional budgets. Participating schools spend an average of only a few percentage points of their overall budgets on marketing, but there are some outliers that spend up to 15%.
Marketing Budget Breakdowns
Now that we’ve looked at overall marketing spend as a percentage of revenue or operating budget across several industries, let’s take a look at how companies allocate their marketing budgets.
Digital Marketing
Overall, companies are spending an average of 53.8% of their marketing budgets on digital marketing. That number varies depending on two main factors:
1. What percentage of a company’s sales happen online
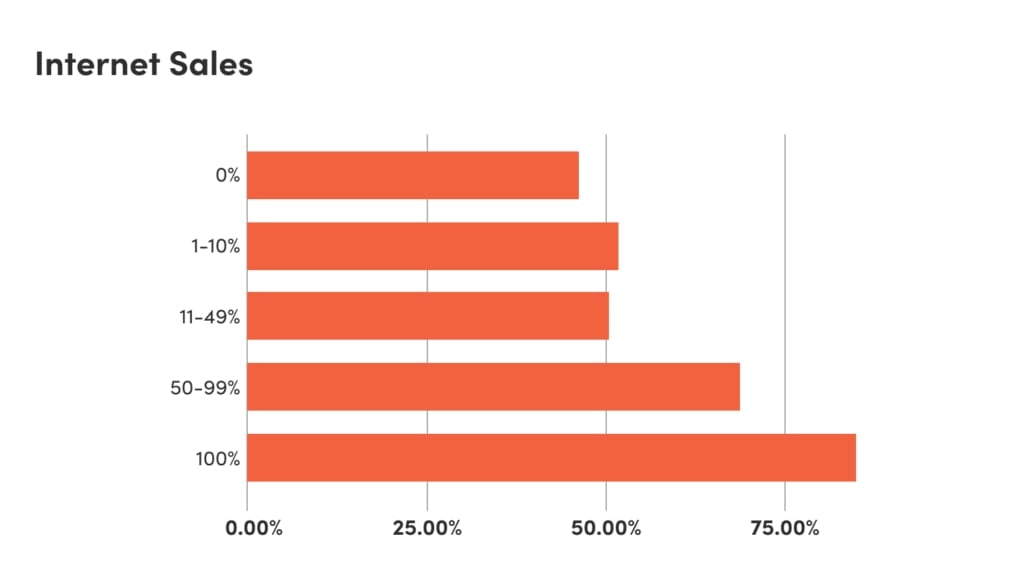
2. Industry Sector
Biggest Digital Spenders
- Education (75.5%)
- Technology (65.7%)
- Healthcare (64.6%)
Biggest Non-Digital Spenders
- Banking/Finance/Insurance (60.7%)
- Real Estate (60.0%)
- Manufacturing (56.0%)
(Source: The CMO Survey March 2023)
Digital marketing budgets were shifting in 2023, with 82% of CMOs reporting that their companies have reprioritized their investment in digital channels, compared to only 59% that reallocated their offline spends.
- 53% are most likely to increase their social media budgets
- 26% are most likely to decrease their search advertising budgets
- 51% increased spending on marketing data and analytics
- 22% plan to decrease their budgets for demand generation and sales enablement
- Mobile spending is predicted to grow 80% in the next five years
(Source: Gartner State of Marketing Budget and Strategy 2023 and The CMO Survey March 2023)
Performance vs. Brand Marketing
Currently, companies are spending more on short-term performance marketing and less on long-term brand-building — but CMOs say they would rather see something closer to a 50/50 split.
Current
- 59.9% on short-term performance
- 40.1% on long-term brand-building
Ideal
- 49.5% on short-term performance
- 50.5% on long-term brand-building
(Source: The CMO Survey March 2023)
How to Plan Your Marketing Budget
Need to Start Planning? Download Our Marketing Budget Template >
You can see from the different budgets across various industries that there is no one-size-fits-all solution to breaking down your marketing budget.
To calculate how much your business should spend, you need to first identify your marketing goals. Does your website need an update? Are you looking to improve the quality of your online leads? We recommend writing a marketing plan to help zero in on what you need to accomplish — and how you’re going to go about it. From there, you can evaluate your company’s marketing budget needs and constraints.
Need help defining your budget and establishing a marketing strategy that delivers measurable return on investment (ROI)? Give us a shout!