“Are we doing what is necessary to achieve our goals?” Well, that’s just about the most important question a business can ask. Does your marketing agency provide quality monthly reports that answer that question? Being updated on your marketing KPIs is crucial for the well-informed decision making needed to shape your company’s future.
A comprehensive monthly report delivers the metrics upon which a company can measure both its sales growth as well as the ROI the marketing agency itself contributes to the bottom line. Data-driven, goal-oriented metrics keep everyone honest and hard at work. A statistician once said, “If you torture data long enough, it will tell you anything.” The reporting aim is the exact opposite; look at all the data, in as many ways possible and efficiently pull the truth from it.
Here’s a look at how KPIs are measured within a typical monthly report. With a seemingly endless array of digital marketing tactics in play, each custom report will inevitably be different, but these four reporting areas are great to start with for most clients.
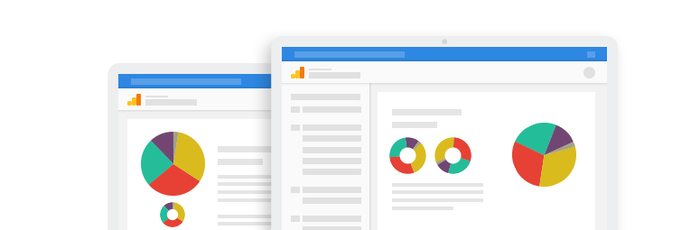
1.) Google Analytics Website Traffic
An in depth look at your site’s traffic in Google Analytics is a great place to begin. Proper tracking ensures we can see how many visitors we brought to the pages that matter most. It’s one thing to have volume, it’s another to be driving traffic to where it will convert. That’s what counts! This is where to see what page ranks for the keywords that draw in that desired organic traffic. Your marketing company should be answering questions like:
- How is performance in local search?
- What proportion of visitors are PPC campaigns bringing in?
- How do we compare to this month last year?
We then use this data to create year-over-year (YOY) traffic charts which are valuable to reference when adjusting campaigns for predictable annual cycles. One tangible takeaway from this reporting came when an HVAC client showed an annual spike in June traffic to their AC maintenance pages which then led to a rush of AC service calls. With summers being short in New England, we thought ahead and orchestrated April/May email and social campaigns focused on pre-season AC tune-ups. This spread out the amount of work for their cooling team evenly over five months instead of the usual overwhelming three.
When looking at your sessions data, don’t forget:
- Your traffic should be reaching your hub pages
- To have the correct tracking in place
- To filter out negligible visits and spam traffic
2.) Early Stage Leads, Sales-Ready Leads and the Sales Funnel
“Is our marketing agency getting us good leads?” That’s certainly another question that will be asked. One can answer this question by watching the rate at which leads convert through the sales funnel. This is when you’ll see if your agency created the best content strategy to draw in that ideal persona who will become a customer.
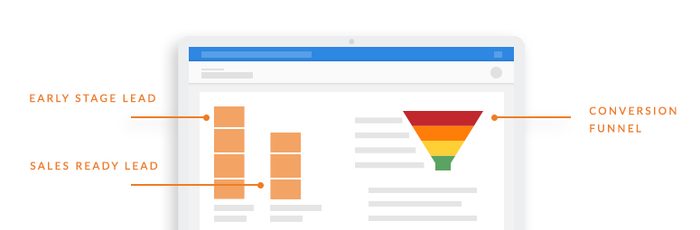
In our reporting, we often use three related slides together to measure this very question: An ‘Early Stage Lead’ stacked bar graph, a ‘Sales-Ready Lead’ stacked bar graph and a conversion funnel slide. Of course, your business reports may use different terminology, but its sales cycle will none-the-less share the same common denominator.
The Early Stage Leads (ESL) are visitors who are starting out in the buyer’s journey. Someone who arrived at a blog post via organic search and submitted their email address to receive educational content would be an example of an ESL. For a mortgage company, it could be a ‘Top of the Funnel’ eBook called “10 Things to Know Before Shopping for a Home” or a mini-course where they receive three emails on how to improve their credit. In the report, we tally up the submissions and enter the totals into a stacked bar graph where each bar in the graph represents a separate tactic or piece of content. When stacked one on top of the other, we can see the sum total as well as each individual effort’s contribution.
The Sales-Ready Leads (SRL) appear in the report much the same way, although these leads are further down the funnel and are converting on materials that signify a higher level of commitment. Their bars in the stacked graph may include CTAs for a ‘Free Trial’ or ‘Contact Sales Now’ form submissions.
Always know:
- Did we reach the persona we targeted?
- Did the CRO A/B test victor actually bring more leads in?
- What content / tactics convert?
And no report would be complete without a funnel slide’s visual illumination of the sales cycle. Here we may show actual monetary numbers coinciding with leads generated. Dynamic reporting provides numerous views for the client. Some clients prefer reports with individual stories, so we might follow a single contact who started off with an eBook download, was nurtured via an email series highlighting educational blog posts, then signed up for the freemium product and eventually became a long-term customer who left a five-star Google review. (What’s not to like about that?) Other reports take a more macro approach where we see how many ESLs on average turn into SRLs and then what percentage convert into customers. This is what we see here in the funnel overview.
3.) Email List growth
A 13-month stacked bar graph with secondary axis works well for an email growth list slide. Clients can clearly see the size of the subscriber list charted above with all the CTAs stacked below. This enables quick identification for what new subscription avenues are up, what are down and how results compare to the same month last year. Maybe live chat was introduced and it is affecting the performance of an existing email submission form. Is one CTA cannibalizing another? Is that a good thing? This is also a great slide to look at and see if anything needs attention and make sure nothing is left behind (a failsafe almost for broken forms).
Keep in mind:
- Is the MailChimp list growing?
- What tactics are bringing subscribers in?
- Which CTAs yield subscribers that actually become good leads?

4.) Goal Sides
We set annual goals for Website Traffic, Early Stage Leads and Sales-Ready Leads and follow progress in each monthly report. The preset benchmarks are based off:
- An audit of historical performance
- A cooperative project management agility metric
- Retainer budget

For example, the goal for Early Stage Leads will be set with a monthly average to be attained by the year’s end. Straightforward math will show us how well we are doing. A good look at a goals slide can be a great starting place for the next strategy conversation. It helps keep the team on their toes and may prompt questions to ask the agency like:
- Are we achieving the goal we set?
- Do we like how we are getting there?
- Do we need to rethink the parameters, the goal, tactics?
Of course, each client is different and a custom report goes far beyond these areas. Whether it’s keyword ranking, exit overlay performance or PPC results, if an action is being taken then it’s probably worth mentioning in the report. We always end the report with a recap slide highlighting bullet points of the month’s work. Every report reader is different, some are visual learners and will perk right up at a YOY ESL chart, others will glaze over even the most interesting graphs requiring that one recap slide that tells them everything that was done and how much time it took or how much money was spent.
We want our clients to love us, and not just because we are charming and fun to be around. We know that results are what matters. We must do the work, understand the results and fine tune the plan. Tangible proof of results is when goals are set and achieved, which is why reporting is so crucial.
Ready to talk more about your monthly reporting? You can reach out to us here.